

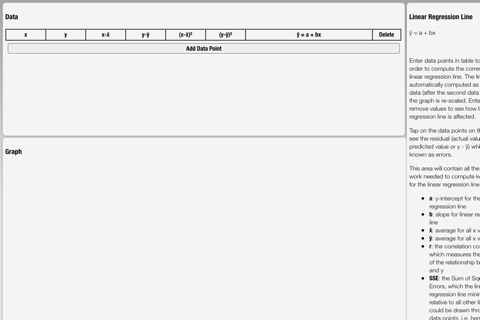
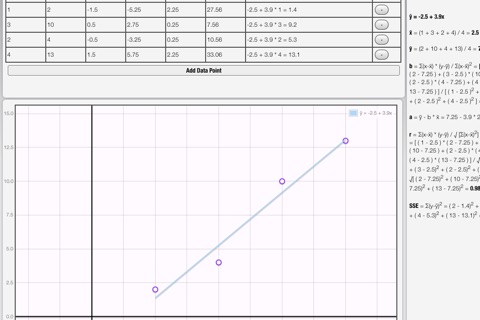

See how the linear regression line is computed from a set of data. Graphs dynamically changes with each new data point showing how the linear regression line is affected. Also, allows students to tap on data points on graph and see how residual is computed.
Great introductory application that will help you build conceptual understanding through numeric, graphical, and algebraic approach.